Let there be listings
- Buyers continue to show up! Number of sales in Greater Vancouver were up 45% from January
- Sellers starting to show up, the number of new listings were up 20% from January
- Bank of Canada continues the holding pattern on its rate – fixed rates declining
- Sales in West Vancouver up 143% compared to January
At the mid-point of February, this month was as much a dark horse to hit 2,000 sales in Greater Vancouver as Billy Mack was to hit the #1 Christmas Song in Love Actually… and like this movie being 20 years old, the sales and new listings amounts feel like they are from 20 years ago. Lack of buyer and seller engagement continues to be one of the significant stories in the market. And as we’ve said before, Metro Vancouver real estate doesn’t have a speculation problem, it has a holding problem. Buyers are holding real estate and not turning into sellers which results in significantly less homes available for other buyers to purchase. But government policy continues to go after the demand side instead of encouraging supply from the existing home stock. Expecting new home construction to fill the void isn’t enough nor realistic.
With the Bank of Canada holding their rate at 5% at the latest meeting this morning, and with the U.S. holding at 5.5% so far this year, the wait continues as to when we might see the first rate cut. The sentiment is that it’s coming. Canadian and U.S. inflation is showing signs of easing, and with the Canadian economy showing signs of weakness, logic would say that rates should be coming down sooner rather than later. Employment numbers remain relatively flat though which isn’t helping in the obvious decision. Canada will likely wait for our neighbours to the south to make the first move, which may come in June when the U.S. has its more in-depth policy decision meeting.
There were 2,070 properties sold in Greater Vancouver in February after, 1,427 properties sold in January this year. This was a 13% increase from the 1,824 properties sold last year in February. Even with one more day in February this year, there were 103.5 sales per day compared to 96 sales per day last year. So, we can’t fully thank the extra day in the leap year for a better February. There is more buyer engagement. The latter half of the month certainly produced more sales, with the last week of the month showing 116 sales per day. A sign the real estate market is continuing to show more activity. This was also the first month where total sales were over 2,000 since August of last year as the fall suffered the fate of two summer interest rate increases by the Bank of Canada. Optimism is gaining in the market as buyers simply need to move on – literally.
With this increase in activity, sales in February were 23% below the 10-year average, after sales in January were 22% below the 10-year average with sales in December 37% below the 10-year average and November’s sales at 35% below the 10-year average. We’re still within a slower moving market, and with a few more listings coming on this month, buyers were given opportunity. And moving forward, they should take advantage of it. February isn’t traditionally a strong month for sales, so expect March to produce more sales, even with spring break in the middle of it.
With the increase sales, we saw a drop to 5 months supply of homes overall in Greater Vancouver, falling back from 6 months in January and 7 months supply in December. Vancouver’s West Side dropped down to 6 months supply from 8 in January and Vancouver’s East Side declined to 4 months (a technical seller’s market) from 6 months in January. Vancouver saw fewer new listings in February compared to other areas of the region, while sales were up 53% compared to January on the West Side and 52% on the East Side. West Vancouver produced twice as many sales in February, bringing months supply down to 9 from 21. Detached sales in each of these cities showing more growth than the other sectors, signalling the upper end of the market is coming back perhaps. The perpetually under supplied North Vancouver dropped down to 3 months supply with condos there at 2 months supply. Further east, Burnaby and beyond have 4 months supply of homes available, with the Tri-Cities down to 3 months supply. Maple Ridge is the anomaly with 5 months supply after significant increase in new listings – up 92% compared to February last year and to 54% compared to January. Active listing counts are up 47% compared to this time last year. Buyers, Maple Ridge is where the opportunities are!
Even with the extra day in the month, we only saw 4,651 new listings in Greater Vancouver. This was well above last year’s total of 3,559 new listings, so that’s a good sign that sellers are coming back, perhaps in response to an uptick in buyer activity. Multiple offers have been occurring in the market more than last fall, an encouraging sign for those sellers that were afraid to enter a quiet market.
The challenge of giving up lower mortgage rates continues for many homeowners through, unwilling to enter a higher mortgage rate to make a move. As renewals begin over the next few months and years and as rates start to come down, we’ll see this pent-up supply start to release more into the market. For some sellers, it may be better to take advantage of a lack of listings now and come on the market and work with a mortgage professional to find the right rate for now in anticipation of lower rates in the next few years. Date the rate and marry the house as they say.
The number of new listings in January were right at the 10-year average, which is an improvement from January where they were 13% below the average and December with the number of new listings in that month being 25% below the 10-year average.
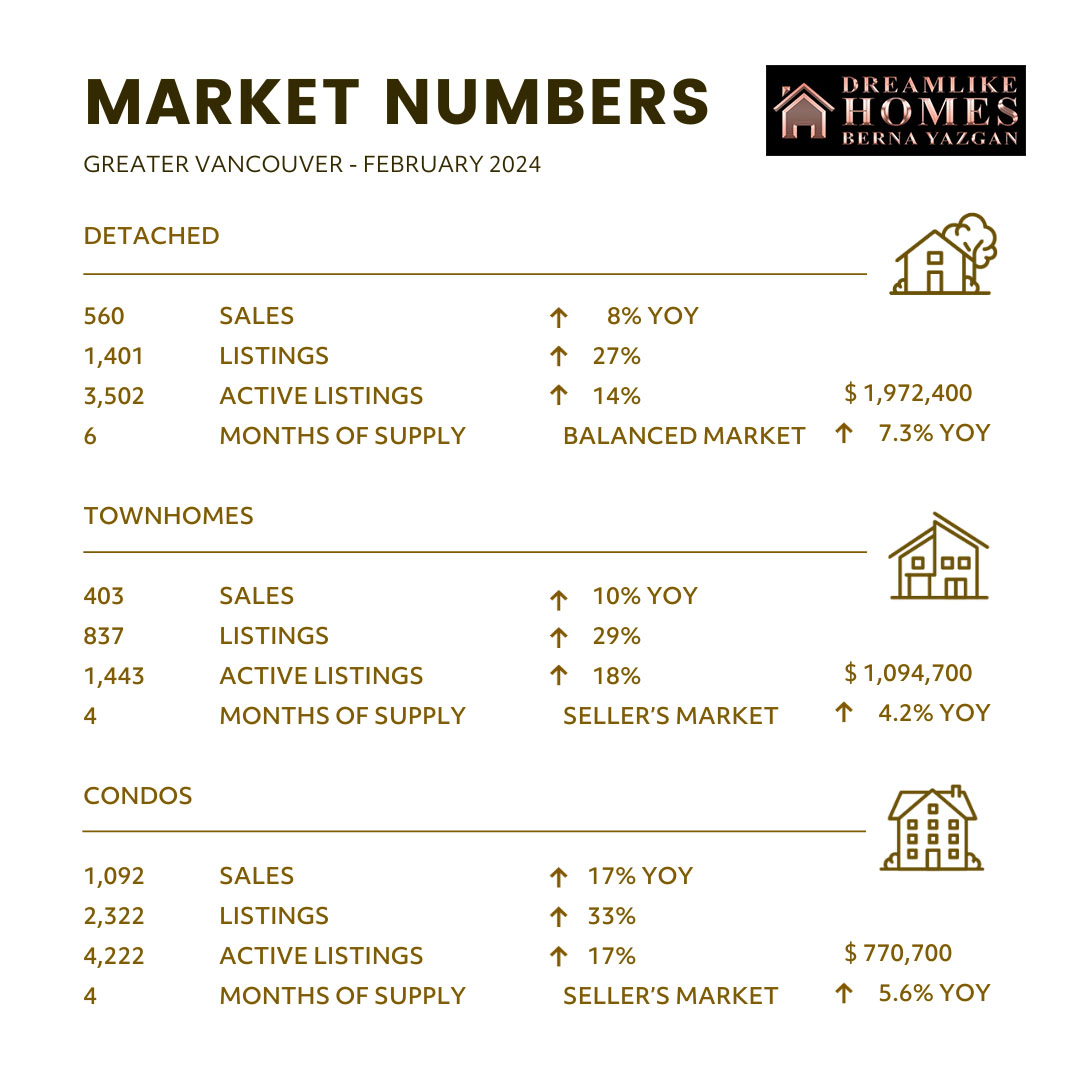
There were 9,634 active listings in Greater Vancouver at month end, after there being 8,633 active listings in Greater Vancouver at the end of January and 8,283 at the end of February 2023. The detached market overall has come down to 6 months supply from 8, putting it into balanced market territory. Townhomes remain at 4 months supply and condos dropped to 4 months supply from 5 – putting both into seller market conditions. Depending on price point and area though, some may be more in balanced market conditions. Absorption rates for detached were 39% for the month while townhouses and condos were at 48% and 47% respectively. All segments saw lower absorption rates compared to last year in February, because of more new listings this year. As a result, we are seeing a gain in the active listing counts. This could bring more buyers to the market, again, a good sign for sellers.
Will March be the lion or the lamb in the real estate market. With a sizable increase in both sales and new listings in February compared to the previous month, will March continue down that path. After the provincial budget was announced, buyers and sellers will continue to navigate an incredible amount of policy changes by government, with an anti-flipping tax of 20% to start in 2025 introduced by the BC NDP. The likely effect of this in the years to come will be a reduced number of listings as sellers hold on to properties more than they already are. Perhaps we’ll see a push to sell before 2024 ends though. Increased thresholds for the Property Transfer Tax exemptions starting April 1st will help those buyers purchasing up to $835,000 for resale and up to $1.1 million for newly constructed homes. The first-time homebuyer incentive has been discontinued at the federal level, much to the dismay of Dawson Creek which was the only region of B.C. where the program worked. Goodbye to bad legislation. Unfortunately, that was not the same for the Foreign Buyer Ban as the Federal Liberals announced a further two-year extension on that program which will now run until the end of 2026. All of which do not help but hinder supply of homes, which is the biggest challenge in the housing market, ironically identified by the government too. Too bad policy doesn’t align with reality.
Here’s a summary of the numbers:
Greater Vancouver: Total Units Sold in February were 2,070 – up from 1,427 (45%) in January, up from 1,345 (54%) in December up from 1,824 (13%) in February 2023, down from 3,451 (40%) in February 2022, down from 3,852 (47%) in February 2021, down from 2,185 (5%) in February 2020, up from 1,512 (40%) in February 2019; Active Listings were at 9,634 at month end compared to 8,283 at that time last year and 8,633 at the end of January; New Listings in February were up 20% compared to January 2024, up 9% compared to February 2023, down 10% compared to February 2022, down 10% compared to February 2021, up 13% compared to February 2020, and up 17% compared to February 2019. Month’s supply of total residential listings is down to 5 month’s supply (balanced market conditions) and sales to listings ratio of 45% compared to 37% in January 2024, 51% in February 2023, 62% in February 2022, and 38% in February 2019. Month-over-month, the house price index is up 1.9% and in the last 6 months down 2.1%. Prices appear to be on the upswing after several months of seeing them decline through the fall.
For other regions, contact Berna Yazgan


Beyond her professionalism, Berna’s warm, friendly, and reassuring approach made working with her a pleasure. She genuinely listens to her clients’ needs and goes above and beyond to help them find the right home. I would trust Berna completely and highly recommend her to anyone looking for a dedicated and reliable realtor.


Our criteria this time were a bit more challenging, but with her patience, deep knowledge, and guidance, we finally found the home that felt just right. Throughout the entire process, she wasn’t just a real estate agent. She was a true advisor and a calm, reassuring presence.
Looking back, choosing to work with her was one of the best decisions we made. We couldn’t be happier with the home we found and the experience we had.
Highly recommended to anyone looking for not just a house, but a place to truly call home. Thank you again!


She was endlessly patient with us—always ready to answer questions, walk us through the details, and offer honest advice without ever making us feel rushed or pressured. From the very beginning, it was clear she truly cared about us finding the right home, not just making a quick sale.
Berna has that rare mix of being incredibly professional and deeply personal. She made what could have been a stressful process feel manageable and even exciting. We always felt supported and in good hands every step of the way.
I’m so grateful for everything she did for us, and I can’t recommend her highly enough. If you’re buying or selling, you’ll want Berna in your corner—both as a realtor and as the genuinely kind person she is.


————