
Highlights of Dexter’s November 2023 report
- New Westminster’s average price is the lowest in the region
- Interest rates are coming down… soon.
- 2023 will have the lowest annual number of new listings since 2002
- West Vancouver House Price Index down 3.7% month-over-month
- BC NDP quickly pass a number of bills to boost supply and curb speculation
The numbers don’t paint a pretty picture. Month-over-month decline in sales, below the 10-year average, and low absorption rates mean fewer new listings are being bought. But there is an optimistic tone to the real estate market and one that will likely see the tilt towards more activity come after the Bank of Canada rate announcement on December 6th. The end of the rate increases has come and the tone to quicker and sooner rate decreases is upon us. The announcement by Canada’s Central Bank is more about tone than actual change in rates and judging by the commentary in markets and by economists, it’s time to start the move downward.
December is always one of the slowest months for sales. The holiday season and the hangover after always impacts buyers and sellers. It’s more about decorating homes for the occasions than staging them for buyers. We’ve passed the high point in total listings, and the march to the end of the year will see less and less to choose from. But we’re still 13.4 percent higher than last year at this time. Whether January produces enough new listings to continue the price declines we’ve already seen in the last few months remains to be seen. But as we’ve said, buyers, your time is now.
November felt more like the 12 Housing Announcements for Christmas with provincial and federal governments putting forward policy after policy on how to create affordability and build more homes. From programs to help buyers save, to density in neighbourhoods and around transit to eliminating short-term rentals in many regions across British Columbia. Nary a stone was left unturned when it came to putting policy forward in November. Will it work? That’s the big question. Will it produce 130,000 homes over the next 10 years in British Columbia and reduce prices by 14% as claimed by the BC NDP? Without modelling, it’s just a wish and one that the NDP has made for Christmas with the numerous bills passed in the legislature at the end of November.
Below 2,000 we continue to go as there were 1,702 properties of all types sold in Greater Vancouver in November after seeing 1,996 sales in October. A similar trend to last year through the fall, although this year’s numbers have been higher. There were 1,625 sales in Greater Vancouver in November 2022 – so it is not all bad in the market especially when we look at 2018 when there were 1,633 sales in November. Total sales for 2023 in Greater Vancouver will likely finish just over 26,000 – down from the 29,227 in 2022. Although this would still be higher than the total sales for the years of 2018 and 2019 at 25,051 and 25,679 respectively. But alas, sales in November were 35% below the 10-year average, compared to 31% below the 10-year average in October.
There is optimism in the real estate market. Perhaps the lack of rate increases by the Bank of Canada through the fall gave some buyers and sellers reason to break free of the stalemate. There’s a noticeable uptick in activity for some listings and it’s resulting in sales for some longer-standing listings.
With current sales, we are in a balanced market with 6 months supply of homes overall in Greater Vancouver while some areas are experiencing less inventory and positioned more in a seller’s market based on total inventory. North Vancouver and Port Moody are sitting with 3 3-month supply, while Burnaby North and South, New Westminster and Port Coquitlam were left with 4 4-month supply. Coquitlam has seen quick growth in inventory in the last 2 months, going from 599 active listings in August to 778 at the end of October. This growth is mainly in the condo and townhouse sectors but still sits with 4 4-month supply.
There were 3,440 new listings in November after 4,752 new listings in October, compared with 5,557 new listings in September, and slightly higher than the number of new listings in November last year at 3,141. By the end of 2023 though, there will likely be 51,500 total new listings for the year which would be the lowest annual new listing count going back to 2002.
The number of new listings in November had declined to 3% above the 10-year average, compared with October with the count being 5% above the 10-year average and September with 6% above the 10-year average. We are seeing more new listings in comparison to sales levels which is helping keep active listing counts higher than the last two years, meaning more opportunity for buyers and with a slower pace of sales, opportunity to negotiate and have time for due diligence.
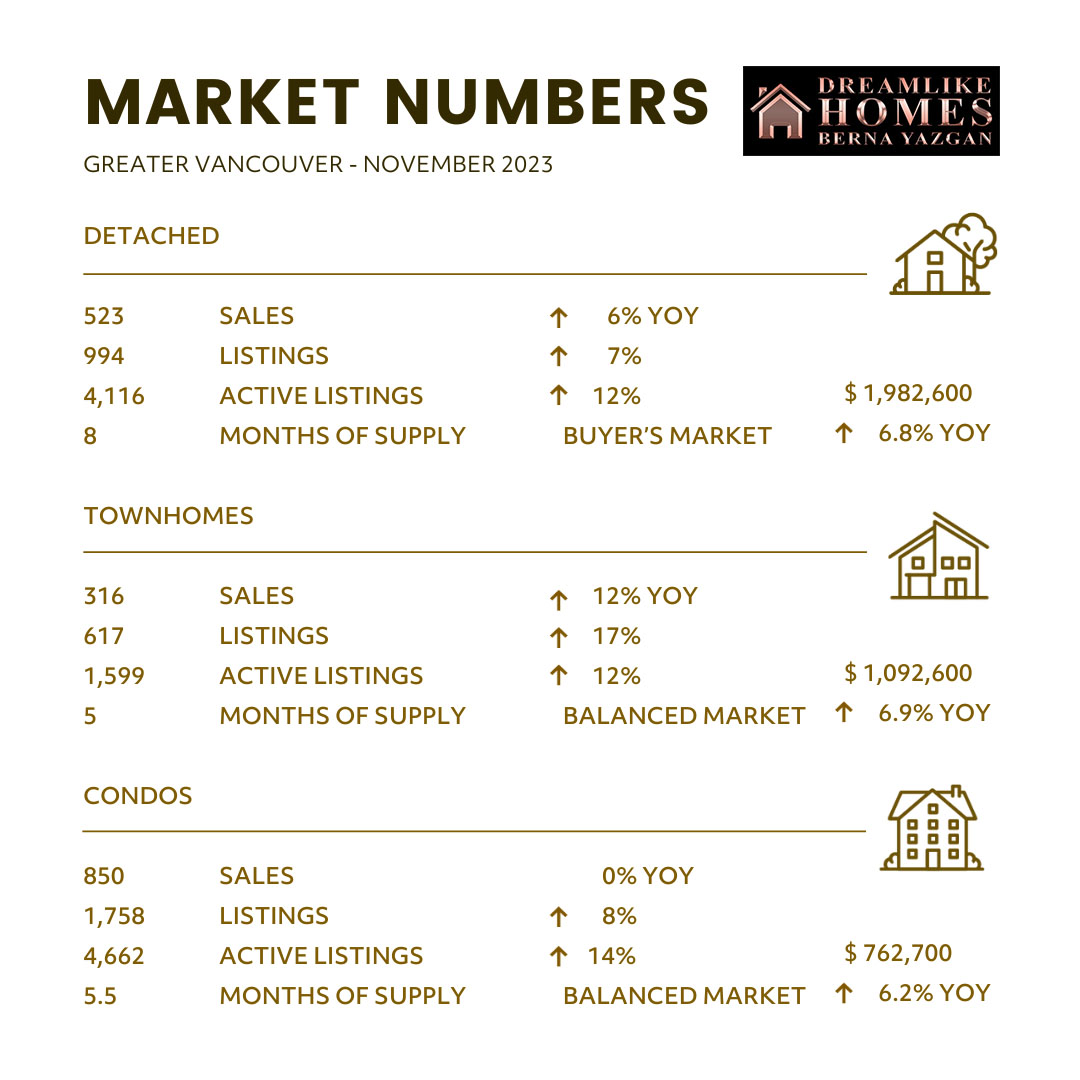
There were 10,931 active listings at month end in Greater Vancouver compared with 11,599 active listings at the end of November and 11,382 active listings at the end of September. With absorption rates much lower than is typical for November, listings are staying on the market longer and the traditional decline in active listings we are seeing in the later part of the year has been much slower. While all areas saw a decline in active listings overall, in some areas there was an increase in condo inventory month-over-month. The detached market overall remains in buyer’s market territory with 8 months supply of inventory but during the month of November the absorption rate was the highest at 52% compared to townhomes and condos, in part to lesser growth in new listings. Townhomes and condos sit just above 5 months supply of listings, bordering on a balanced market after being in seller’s market territory for some time.
Here’s a summary of the numbers:
Greater Vancouver: Month-over-month, the house price index is down 1% and only up 4.9% year-over-year. Total Units Sold in November were 1,702, down from 1,996 (15%) in October 2023, down from 1,926 (12%) in September 2023, up from 1,625 (5%) in November 2022, down from 3,492 (51%) in November 2021, down from 3,131 (46%) in November 2020, down from 2,546 (33%) in November 2019; Active Listings were at 10,931 at month end compared to 9,633 at that time last year and 11,599 at the end of October; New Listings in November were down 28% compared to October 2023, down 38% compared to September 2023, up 10% compared to November 2022, down 15% compared to November 2021, down 17% compared to November 2020 and up 12% compared to November 2019. Month’s supply of total residential listings is steady at 6 month’s supply (balanced market conditions – detached homes at 8 months supply, a buyer’s market) and sales to listings ratio of 49% compared to 42% in October 2023, 52% in November 2022 and 87% in November 2021.
For other regions, contact Berna Yazgan